
Helping people see and understand queries - Visualize your own query!
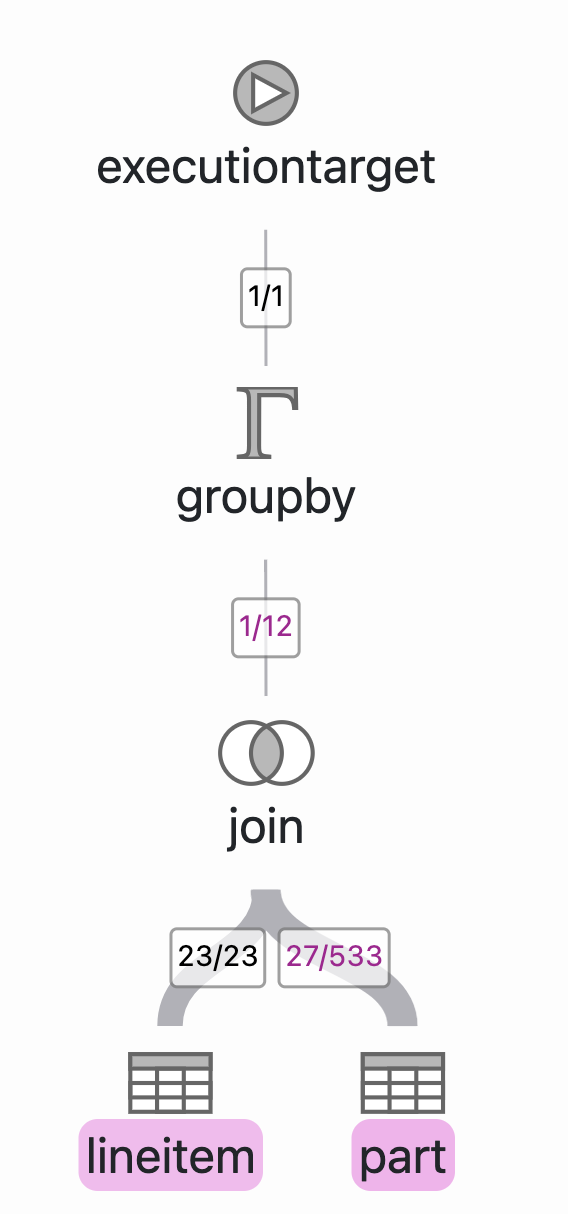
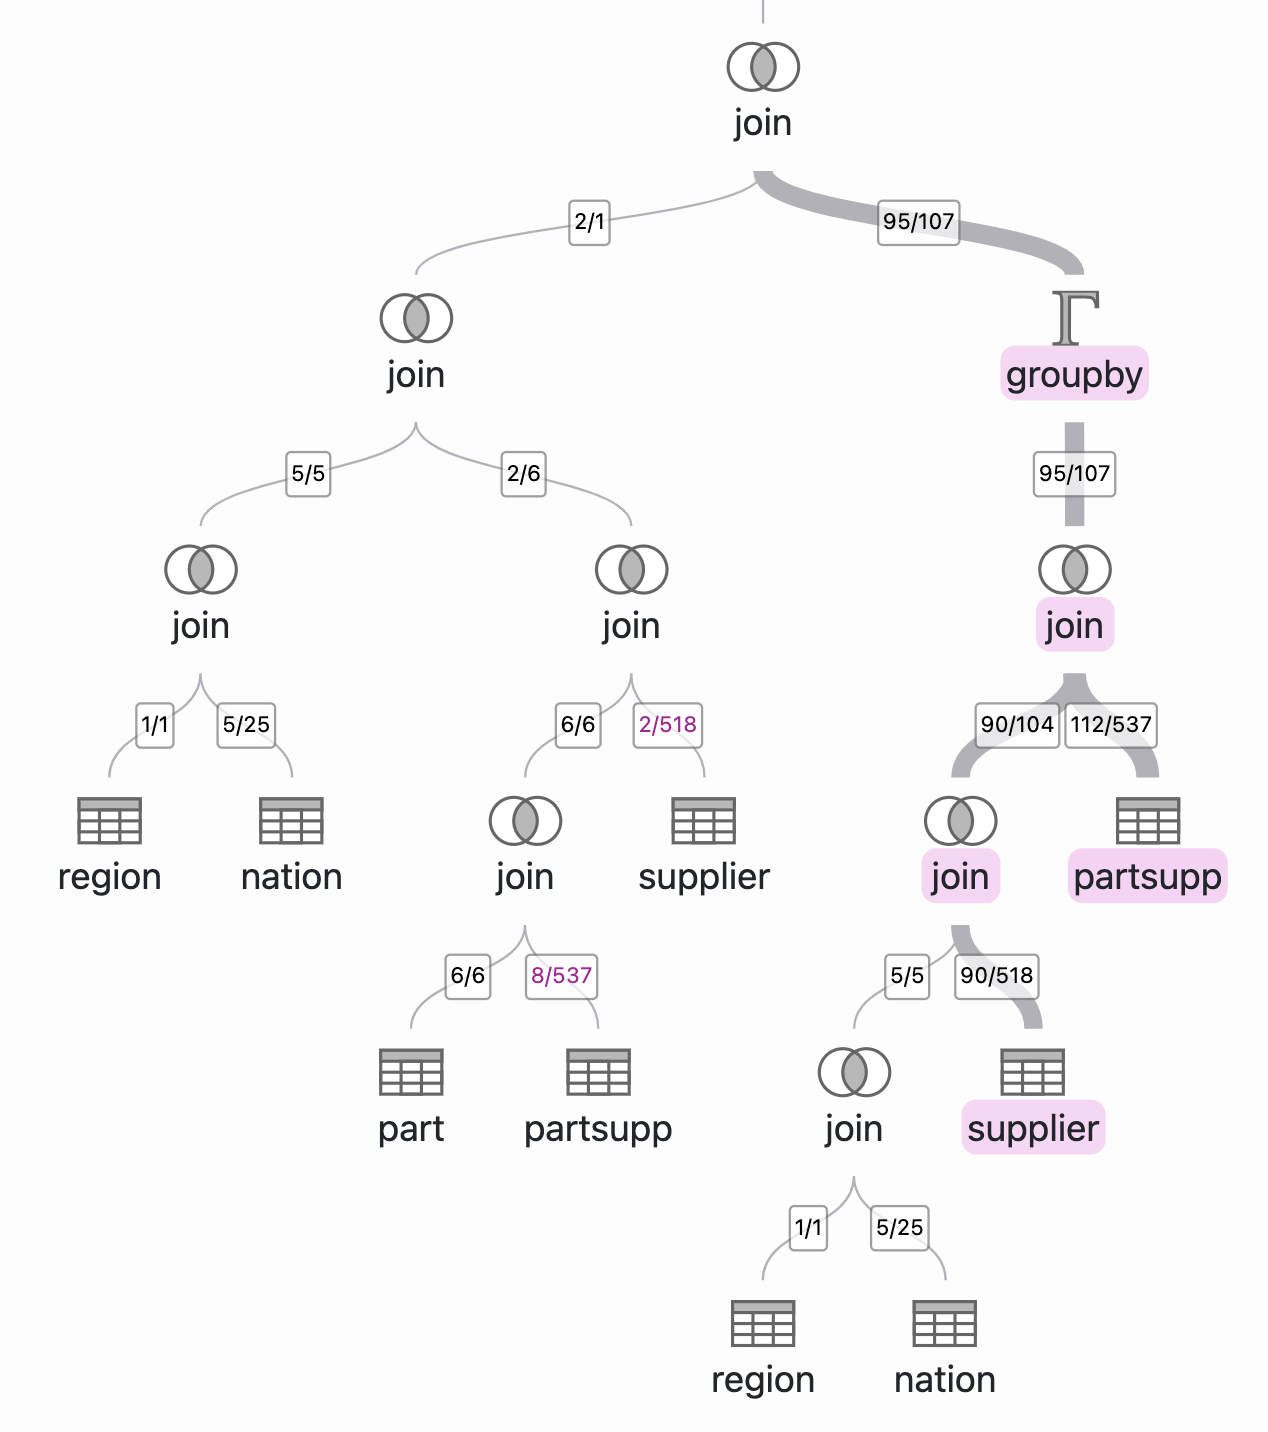
"Query graphs" visualizes query plans for PostgreSQL, DuckDB, Hyper, Umbra/CedarDB, and Tableau logical queries and can easily be extended for other database systems.
Query graphs is based on the experience of Tableau and the Hyper team with debugging complex OLAP queries.
In contrast to many competing plan visualizers, query graphs:
- visualizes large and complex query plans without presenting an overwhelming amount of information,
- immediately draws your attention to the most critical parts of the query plan through proper color coding,
- allows you to drill down on the interesting parts of the query-plan, e.g., by expanding more details by clicking on the node of interest,
- supports multiple different plan types (currently PostgreSQL, DuckDB, Hyper, Umbra/CedarDB, and Tableau logical queries),
- can be easily embedded into larger tools,
- works fully offline and can be installed as a "web app" from your browser.
For a first impression, see our list of example visualizations. A few examples are:
You can use https://tableau.github.io/query-graphs/, you do not need to install anything.
If you still need a local deployment, see the build and deployment guide.
- Go to https://tableau.github.io/query-graphs/
- Open your query plan, e.g. by copy pasting
- Visually explore the query plan
Note that we never upload your query plan.
All processing happens directly inside your browser.
The query plans never leave your machine - we value your privacy ;)
Supported query plan formats:
- PostgreSQL's JSON format, obtained by
EXPLAIN (FORMAT JSON). It is particularly useful with EXPLAIN (ANALYZE, FORMAT JSON).
- DuckDB's JSON format, obtained by
EXPLAIN (FORMAT JSON) or EXPLAIN (FORMAT JSON), and optimizer-stage output.
- Hyper's query plans. You can run Hyper (the database system powering Tableau) locally through HyperAPI, and send Hyper
EXPLAIN (VERBOSE) queries to obtain query plans. See dump-plans.py for an example.
- Umbra and CedarDB JSON plans, including analyzed plans and optimizer stages.
- Tableau logical queries. Can be obtained from the log files of Tableau Desktop or Tableau Online.
Pull requests welcome!
In particular, we would be happy about support for additional query plan formats from additional database systems.
New core functionality is also welcome, but you might want to open a GitHub issue first and get some feedback, before spending considerable amounts of time on cool new features.
To get started hacking on query graphs, see the developer documentation.
Query Graphs uses the amazing react-flow library for rendering. For layouting the query plan, we use d3-flextree.

